Who Contributes More to the TSP: Army, Air Force, Navy, or Marines?
April 9, 2012
The Thrift Savings Plan was opened to members of the uniformed services ten years ago. Military personnel were allowed to participate in the TSP for the first time beginning in January 2002 with a 2001 amendment to the National Defense Authorization Act for Fiscal Year 2000.
Ten years later, which service has the highest participation rate?
As of the end of December 2011, the numbers broke out this way: Among active duty personnel, the Navy had the highest participation rate, with 58.7% of service personnel or just over 190,000 personnel contributing. The Air Force was second, with 37% of personnel or just under 122,000 contributing. The Coast Guard followed with 33.7% or just over 14,000 contributing. These were followed by the Marines with 33.3% or over 67,000 personnel contributing, and the Army at 31.4% or over 176,000 contributing. Thus the Navy had both the highest percentage of TSP participants, and the highest number of personnel who contributed to the TSP.
While 59% of National Oceanic and Atmospheric Administration personnel contributed, I did not include them because of the small number of employees included in this group: 191. I similarly did not include Public Health Service personnel, 54.7% of whom contributed, because of the relatively small number of participants at 3,603.
Reservists had a much smaller participation rate, with only 16.2% of reservists overall contributing to the TSP. Among reservists, 22.1% of Air Force personnel contribute, followed by 16.7% of Coast Guard personnel, and then 15.3% of Army personnel, and only 11.7% and 9.9% of Navy and Marine Corps personnel respectively contribute to the TSP.
Here is a snap-shot of the participation rate among uniformed services personnel, from FRTIB statistics:
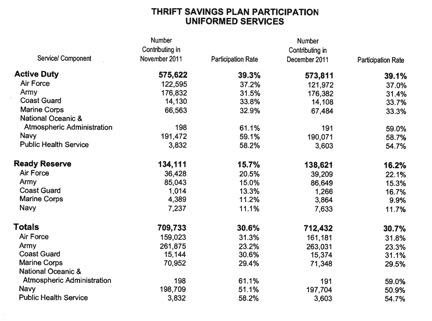
Uniformed Services Participation Rates in 2011
And the chart below shows the increase in total number of uniformed services TSP participants since 2002, with 712,000 TSP participants as of December 2011:
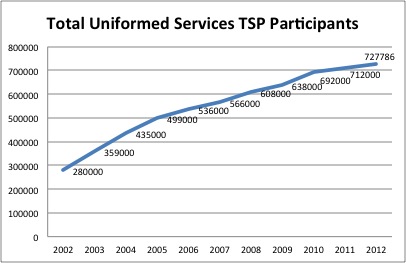
*2002-2009 data as of September each year; 2010-2011 data as of December each year
Related topics: investing-styles long-term-investing military-investing