Putting the 'Heat' in the TSP Funds
March 15, 2021
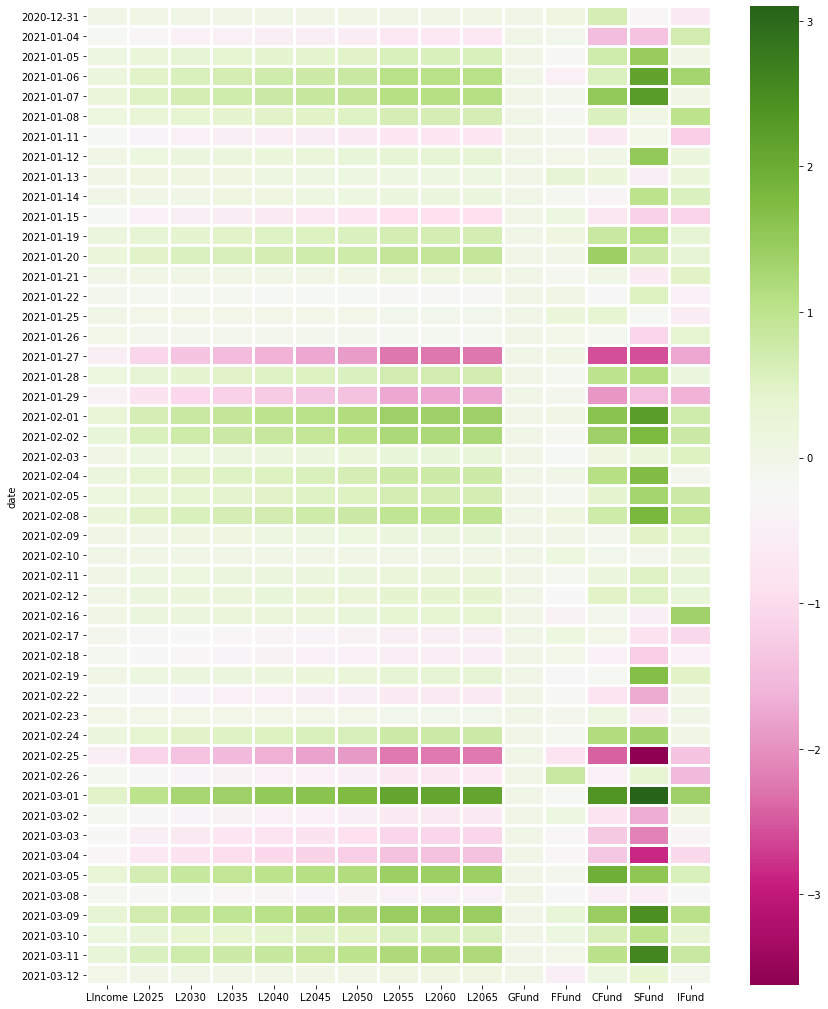
This weekend marked a year since the sudden shutdown due to the pandemic. For a slightly different perspective on how the funds performed daily during the past year, let’s take a look at some heatmaps of the funds.
 Photo by Shelly Collins on Unsplash
While this site posts on monthly fund volatility such as here and here - as well as the daily stock prices here and here - we’ve yet to take a look at daily fund returns.
Heatmapping the TSP Funds
The heatmaps below show the percentage increase and decrease via color gradients. The more verdant and intense the green, the greater percentage increase the fund experienced for that day. The more red it is, the greater percentage decline the fund experienced. The color legend is on the right of the heatmap, and the funds are noted at the bottom. You can probably guess which funds are which, just based on the relative coloration in each column over time.
The stock funds at the beginning of the year experienced periods of relative sanguinity, interspersed with sudden declines. But the L Funds have experienced degrees of volatility as well, as has the F Fund to some extent. Here is a heatmap of the TSP funds since the turn of the year, where a few days in particular jump out:
A year after the sudden shutdown due to the pandemic, let’s take a look at a heatmap of the funds over the past year. *Note that the expanded L Funds were not in existence in the spring of 2020, so they are excluded from this heatmap:
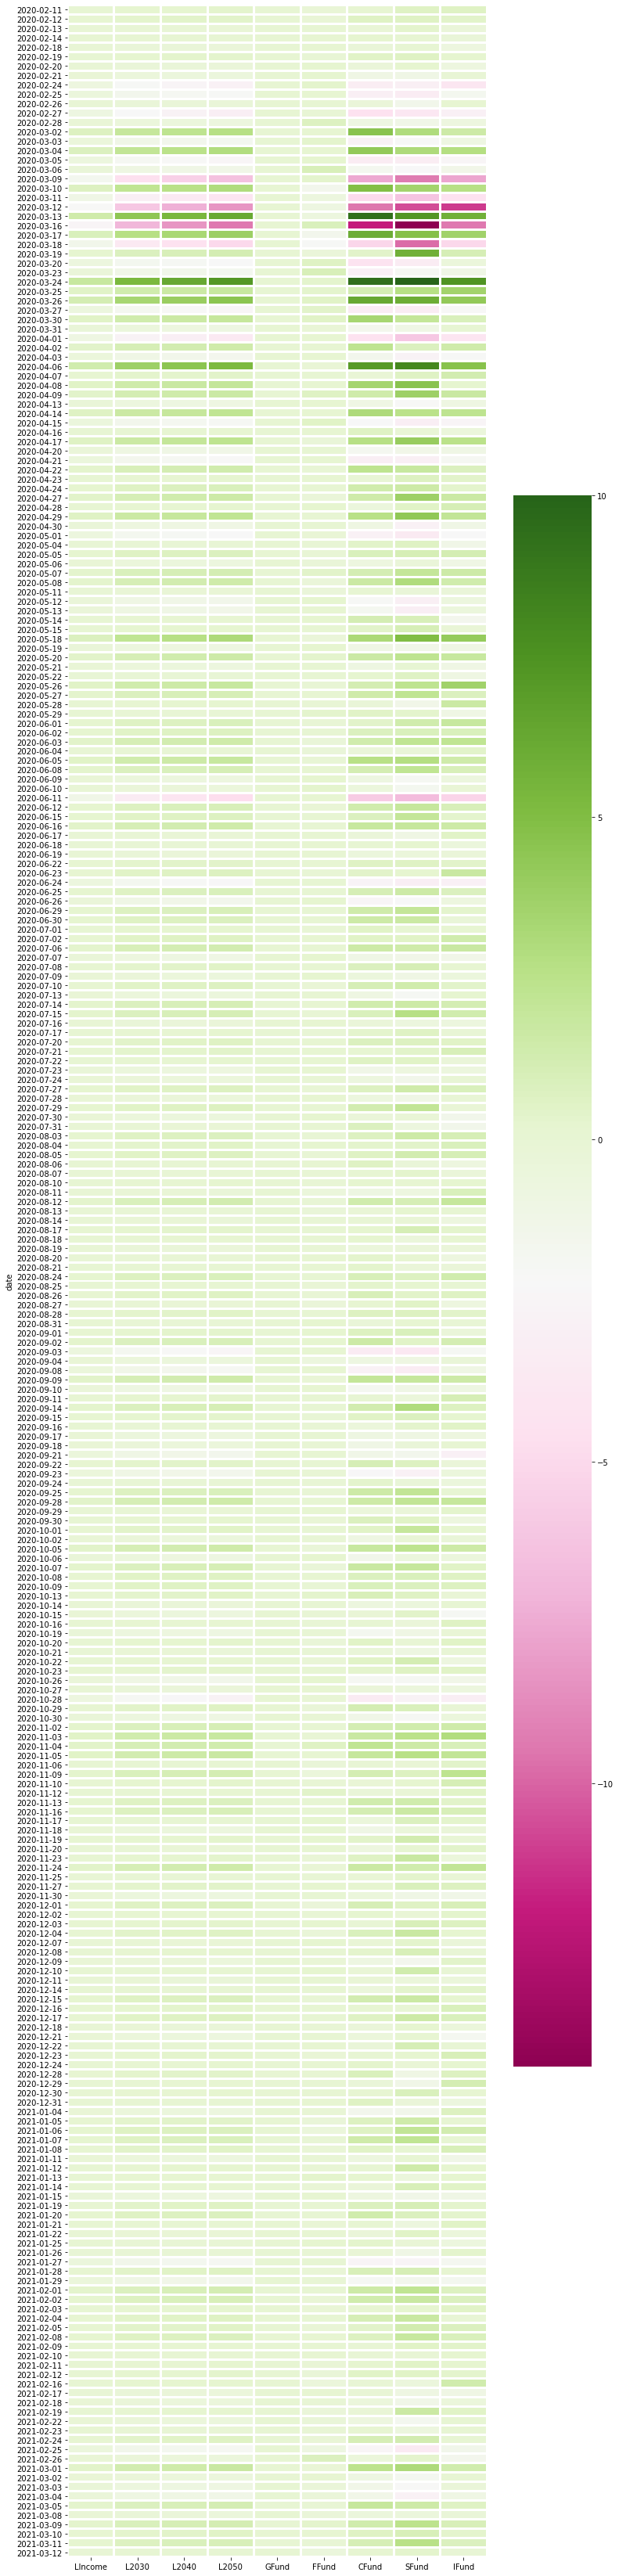
The degree of variability over the past year is different compared to the past few months, as represented in the heatmap legend on the right. The legend for the first heatmap ranges from +3% to -3% or so, while the legend for the second heatmap over the past year ranges from +10% to almost -15%! So the ‘heat’ of the past couple of months is lower compared to the ‘heat’ of the funds particularly this time last year. As we all remember, there were some major declines a year ago, followed weeks later by days of strong market returns. Comparatively, the > -3% declines on February 25 and March 4 this year seem like mere blips over the past year.
In a positive sense, the daily changes of the funds over time offers opportunities to “dollar-cost average” into the funds. Those who continued to buy and hold the stock funds especially, as examined here and in TSP Investing Strategies based on over a century of historical data, will have done quite well over the last year.
Related topics: c-fund i-fund s-fund g-fund f-fund l-funds blackrock