Tech and the TSP
July 25, 2020
Tech has taken over the TSP.

Photo by ThisisEngineering RAEng on Unsplash
Apart from the recent updates to the public-facing TSP site, the technology sector in the stock funds have thrived relative to other sectors as well.
As of July 23rd, the information technology sector makes up almost 27% of the C Fund. Here’s how the sectors look as of that date. As you can see, tech is the largest sector - and it is actually down a percent or so in the past couple of weeks from over 27%:
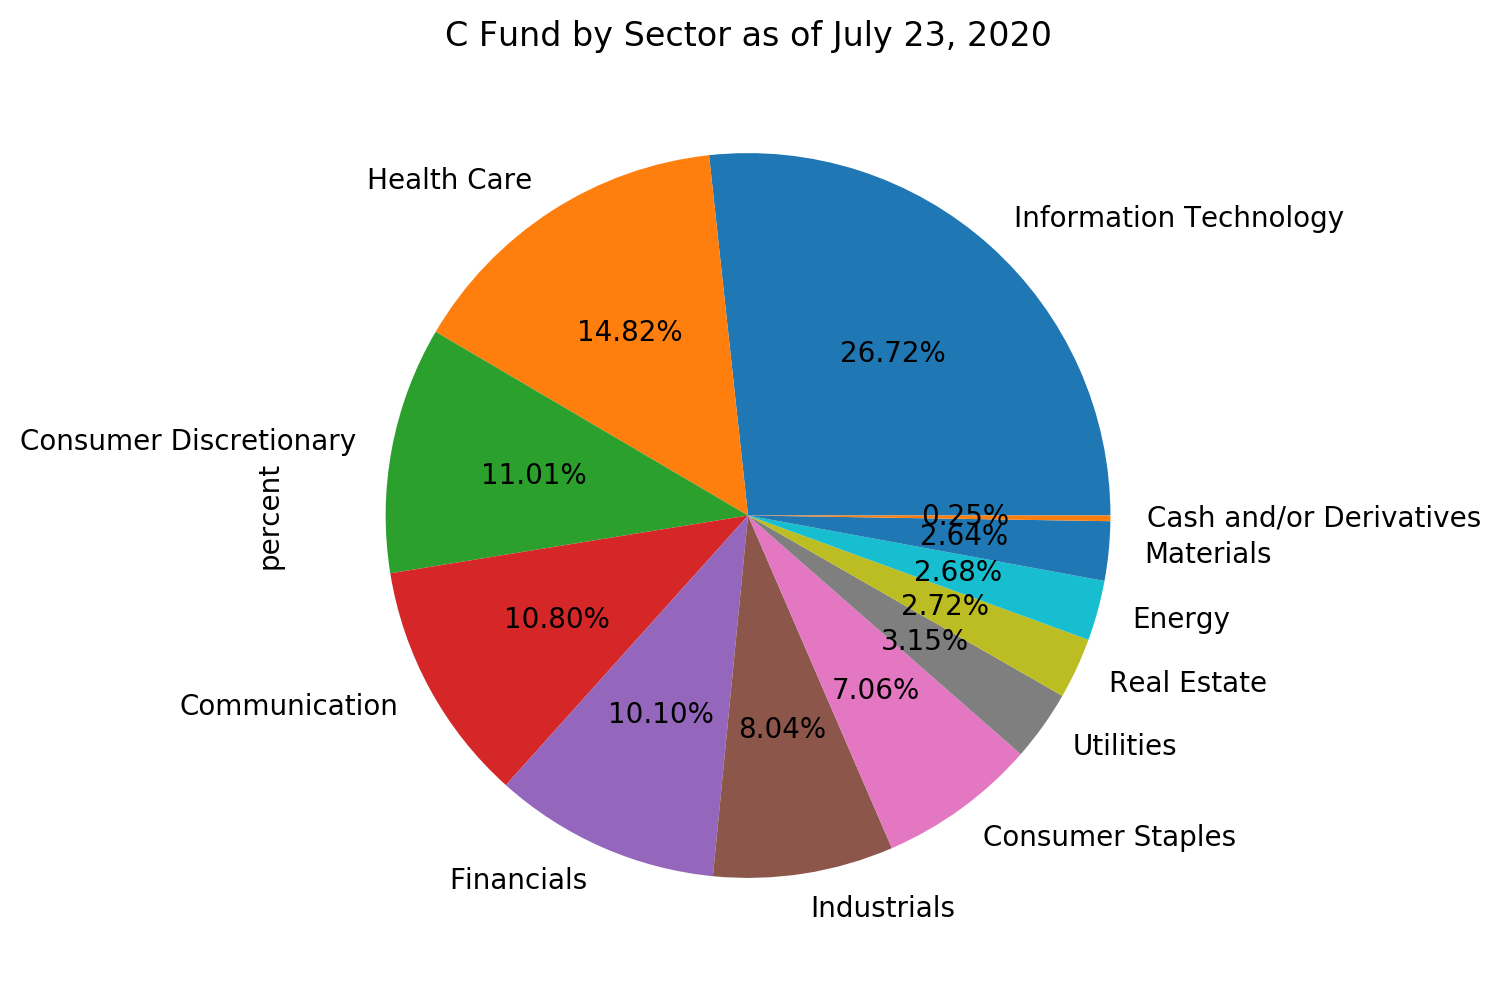
This is an increase from about 23% as of December 2019 (see this repo for underlying data files and methodological approaches).
But this actually undercounts the actual “tech” sector. This is because many of the companies that we popularly know as “tech” companies are defined in the index break-down as “communication” companies. So, Facebook, Alphabet (Google), and Netflix are all categorized as constituents of the “communication” sector.
Taking the “communication” sector into account, here are the top 20 tech companies in the C Fund:
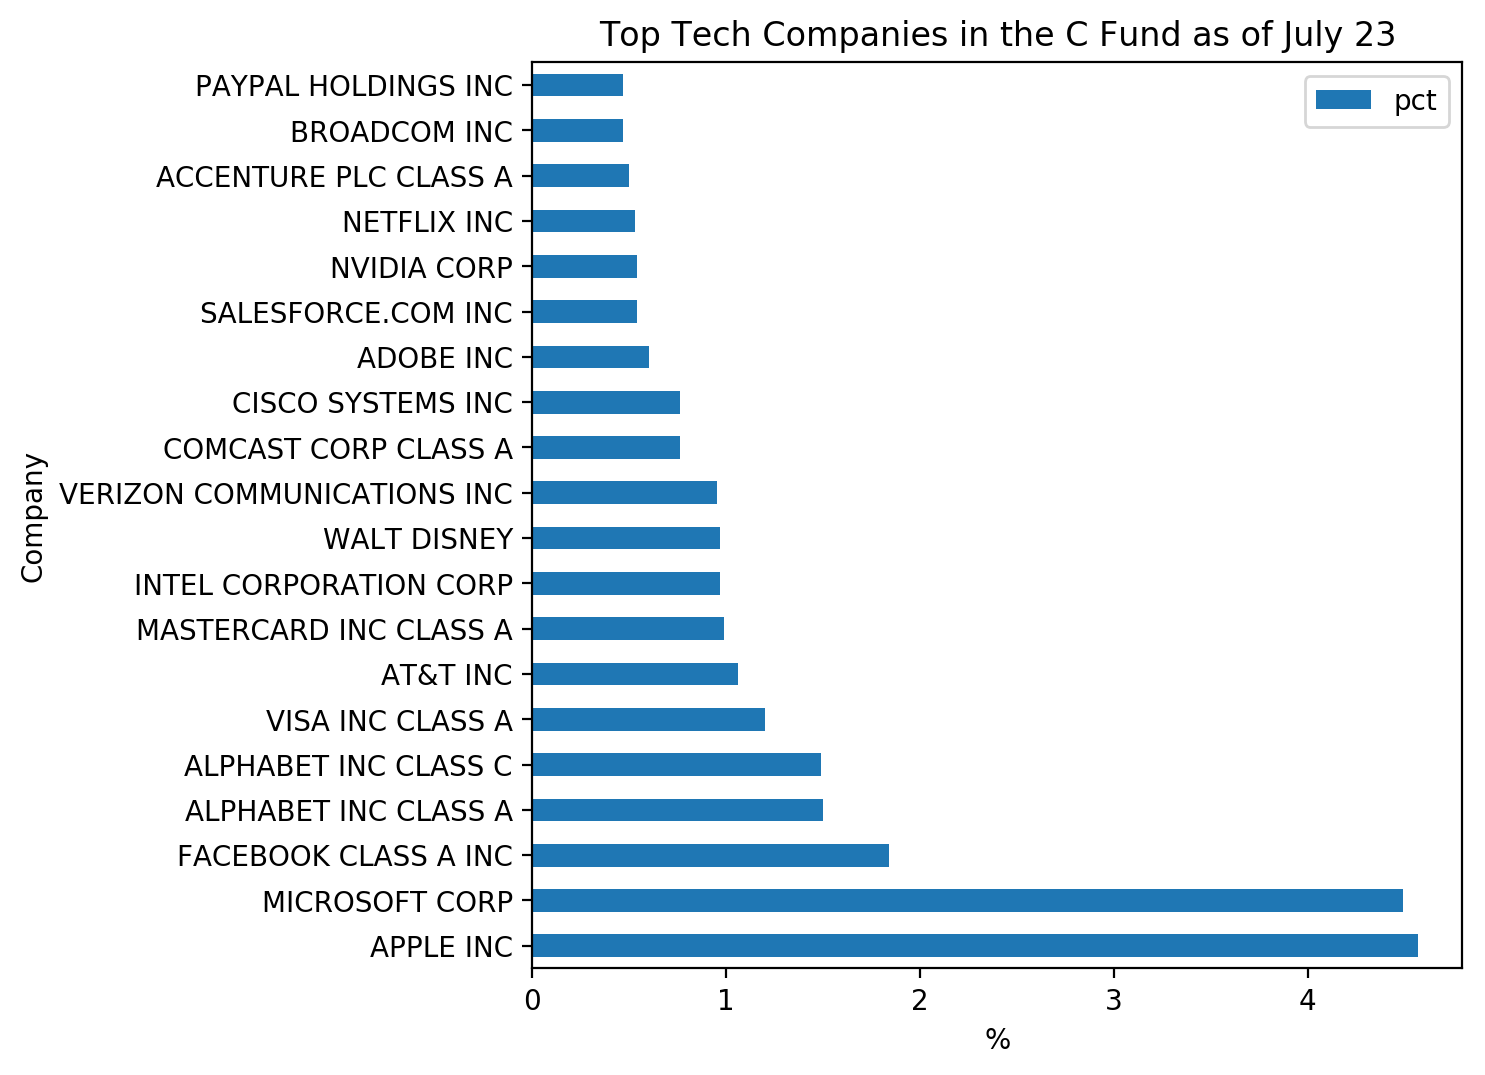
In fact, the top five companies in the C Fund, all of which are tech companies, make up over 22% of the fund. (“Alphabet” – the parernt of Google – appears twice because of the different types of shares.)
And even then, major tech companies like Amazon aren’t listed: Amazon is classified as a member of the “consumer discretionary” sector, yet there’s no denying that Amazon is a major tech company.
Separately, the I Fund tech sector is not nearly as big as in the C Fund. Here’s a comparative breakdown of each fund by sector:
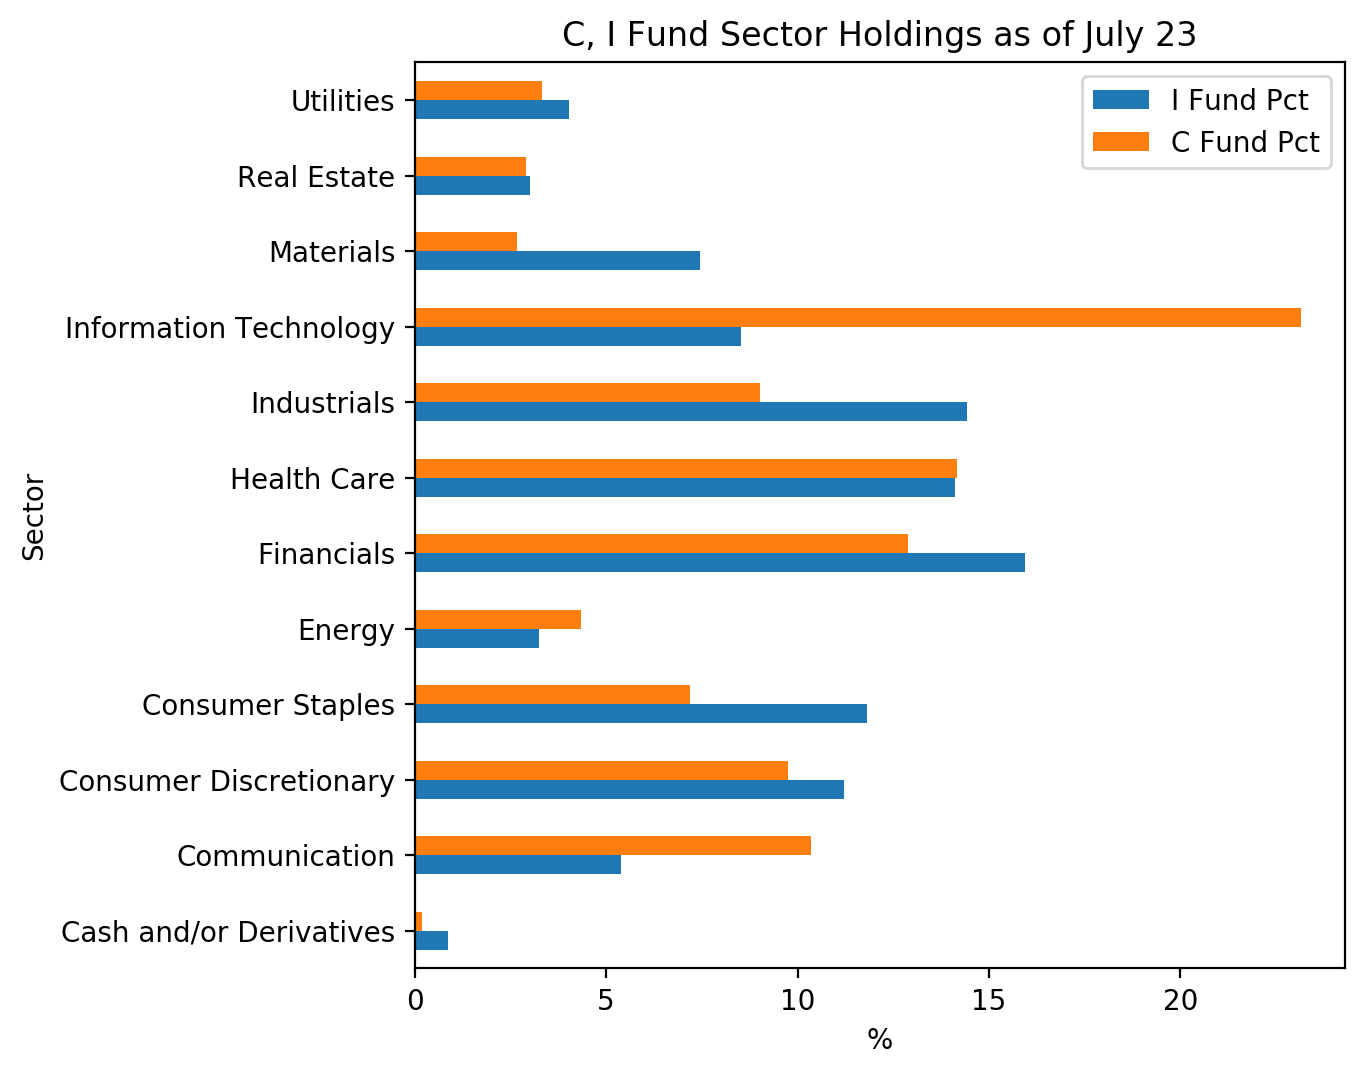
As you can see, the I Fund sector is a mere 8.53% compared to the C Fund’s 27%! A snarky comment could be made here that this represents the flourishing tech sector in the United States, as exemplified by the top-5 spot of the world’s largest tech companies having been created and residing here in the United States. But a more balanced view would take into account the fact that the underlying index of the I Fund includes almost 1,000 companies in it, while the underlying index of the C Fund includes about half that. Also, the countries where multi-national corporations are headquartered and listed have their own “centers of excellence,” lending balance to the overall sector and constituent makeup of the index in developed countries. This is a good thing, since we don’t want to be over-weight in any particular sector.
For perspective, of the entire $600 billion TSP holdings (as of May - see second graph), the C Fund makes up almost exactly one-third of total holdings, while the S and I Funds make up about 10 and 7.4 percent each, respectively. (See this post for detailed data by fund.) Thus equity holdings make up about half of total holdings, with technology companies making up about a third or more of that amount.
The above figures represent data as of late July. Updated top-50 and sector holdings of the C, S, and I Funds can be found here.
Related topics: c-fund i-fund s-fund blackrock statestreet